1. Methodological Premise: Q-CTA as a Quantitative Analytical Framework
In the institutional trading landscape, a frequent terminological misconception identifies “Q-CTA positioning” as a specific asset class or fund type. In reality, there are no investment vehicles named Q-CTA. The acronym refers exclusively to the Menthor Q CTAs Funds Model, a proprietary quantitative algorithm developed by the intelligence platform MenthorQ (menthorq.com).
This is an analytical framework designed to estimate, in real-time, the net exposure and risk-weighting of CTA (Commodity Trading Advisor) funds across a broad spectrum of underlying assets. It is not an investment product, but rather a tool for monitoring systematic institutional flows. The model “decodes” the operations of CTA funds (or managed futures)—regulated hedge funds employing quantitative trend-following strategies—to detect the injection or drainage of market liquidity.
2. CTA Fund Dynamics: Genesis, Strategy, and Systemic Impact
Commodity Trading Advisors (CTAs) are professional asset managers, registered with the CFTC and NFA in the United States, specializing in capital management through listed derivatives. Despite the etymology of “Commodity,” they currently operate across over 150 global markets, including equity indices, interest rates, currencies, and fixed income.
Operational Pillars:
- Systematic Strategy: They operate via trend-following (momentum) models. Rigorous algorithms trigger long positions during established uptrends and short positions during corrective phases. While these are lagging indicators, they act as volatility catalysts once technical triggers are activated.
- Leverage and Correlation: They utilize regulated futures with high financial leverage, maintaining a historically low or negative correlation with traditional asset allocations.
- Market Relevance: They serve as liquidity providers on technical breakouts and as trend amplifiers during capital inflows. In stress scenarios, their rapid de-risking can either stabilize prices or exacerbate volatility.
- Performance and Crisis Alpha: With an average annual return of ~6.9%, they offer protection during systemic shocks (e.g., 2008, 2020, 2022). However, 2025 saw record drawdowns due to “V-shaped” reversals and macro shocks related to trade tariffs and interest rate instability. The constant growth of Assets Under Management (AUM), enhanced by AI, makes their influence a critical focus for investment banks like Goldman Sachs.
3. Architecture of the Q-CTA Model: Metrics and Visualizations
Unlike CFTC data (Commitment of Traders), which suffers from excessive latency, the Q-CTA model employs proprietary inputs similar to those used by prime brokerage desks: spot prices, momentum, and technical thresholds. It estimates exposure as a fraction of the total risk allocable by the CTA complex.
The information set is organized into 4 tables:
- Main Table: Multi-asset overview.
- Index Table: Focus on equity indices (SPX, Nasdaq).
- Currencies Table: G10 FX monitoring.
- Commodities Table: Analysis of metals and energy.
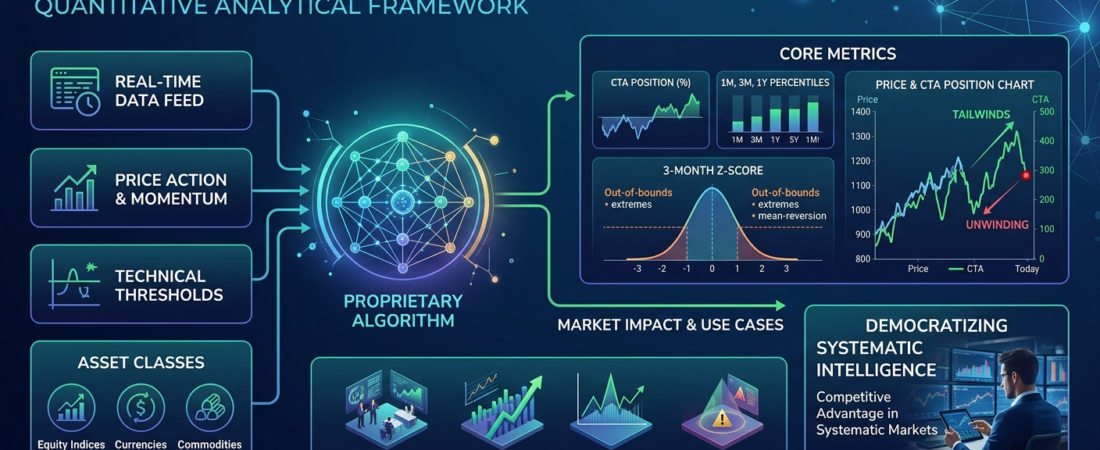
Core Metrics and Interpretation:
- CTA Position: Indicates the percentage of allocated risk (Long >0; Short <0). The delta change allows for the identification of position accumulation or distribution.
- Percentiles (1M, 3M, 1Y): These measure relative exposure. A 1Y percentile at its lows (<0.20) coinciding with a maximum 1M percentile (=1) suggests a potential bullish reversal following a capitulation phase.
- 3-Month Z-Score: Expresses the standard deviation from the quarterly mean. Values of $|Z| > 2$ signal statistical extremes, suggesting potential mean-reversion or trend exhaustion.
Graphic Analysis: The intersection of price action (left axis) and the positioning line (% risk, right axis) visualizes systematic support: a positive slope in the green line indicates institutional tailwinds, while a contraction signals an unwinding phase.
4. Operational Execution and Strategic Integration
In trading strategies, the model serves three primary functions:
- Trend Validation: Rising prices supported by increasing positioning indicate robust momentum.
- Risk Zone Identification: Extreme positioning and high Z-scores warn of potential violent reversals.
- Volatility Forecasting: Excessive overcrowding (crowded trades) on one side of the market increases the risk of a squeeze.
Synergy with the MenthorQ Ecosystem:
The model’s efficacy increases when integrated with the Q-Score (momentum and seasonality) and Net Gamma Exposure (GEX). A setup featuring CTA accumulation, a high Q-Score, and the absence of overhead gamma walls constitutes one of the most robust frameworks for institutional positioning.
5. Analytical Constraints and Critical Considerations
Despite its accuracy, the model has inherent limitations: it is a proprietary algorithm based on probabilistic estimates rather than certified real-time data; it acts as a proxy that may diverge during atypical flow events; and it shares the lagging nature of the strategies it monitors. Furthermore, full data access is contingent upon commercial subscriptions. Nonetheless, it remains an indispensable tool for bridging the information gap between obsolete public reports and real-time flow dynamics.
6. Conclusion: The Centrality of Systematic Flows
In markets dominated by algorithmic execution, monitoring CTA positioning is no longer optional—it is a necessary competitive advantage. MenthorQ’s Q-CTA model democratizes access to data once reserved for elite investment banks. As systematic capital expands and AI-driven strategies evolve, the impact of CTAs as market drivers is set to intensify.