
Traders inevitably encounter phases of uncertainty when a technically flawless level such as a textbook support a clean trendline or a classic pattern is breached without any apparent catalyst and price advances directly against the anticipated direction. The recurring question remains what critical element was overlooked in the process
In most situations the explanation resides not within price action itself but rather in the underlying volume dynamics instead
Price action conveys the what whereas volume communicates the relative intensity of market conviction
A candlestick chart shows the specific price levels at which market participants were prepared to transact yet it does not reveal the true strength of their collective commitment Two identical price breakouts may imply entirely opposite outcomes depending on whether one develops on triple the average volume while the other occurs on merely one third the former usually indicates genuine institutional participation whereas the latter frequently represents a deceptive trap
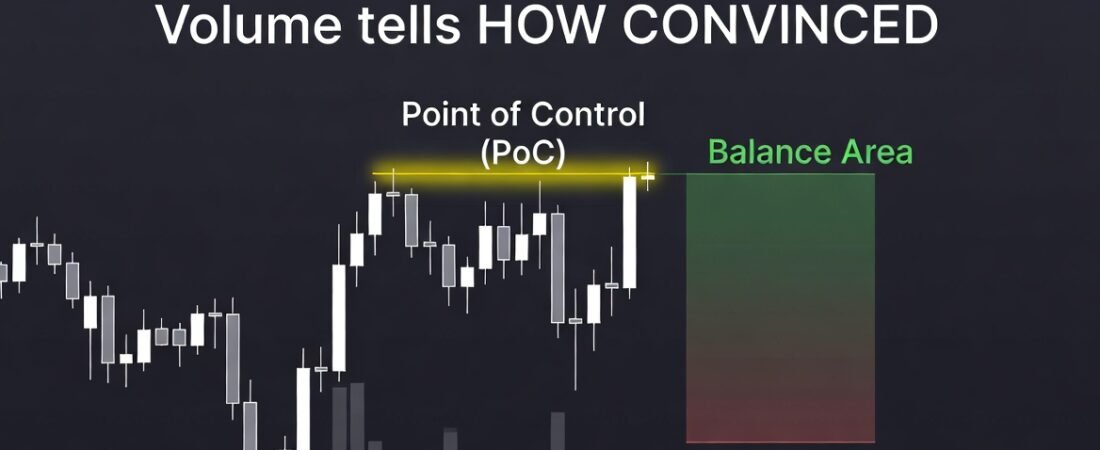
The Point of Control represents the true gravitational center of the market
The foundational notion is the Point of Control PoC namely the precise price level where the greatest volume of transactions concentrated over a defined time interval It does not constitute a psychological level a round figure or a Fibonacci retracement it is merely the price that market participants through actual executed trades have collectively validated as the fairest value at that specific moment
The PoC functions as a powerful gravitational anchor Whenever price deviates substantially from this level without adequate volumetric support the statistical probability of reversion toward the PoC rises not because markets are absolutely predictable but because positions opened far from the prevailing value consensus tend eventually to be attracted back toward zones of maximum liquidity concentration
Balance Area and Reversal Area zones where the market reaches consensus and where it fundamentally alters its stance
Around the PoC forms the Value Area the price band containing the largest portion of overall trading activity When this band is wide and symmetrical the VolCharts protocol designates it as a Balance Area an institutional equilibrium zone characteristic of ranging market environments where buyers and sellers achieved a lasting balance A well developed Balance Area acts as the authentic structural floor to which price tends to return during deeper retracements distinct from conventional chart based support levels
The case differs for a Reversal Area consisting of an elevated yet narrow volumetric concentration formed precisely when the market shifted control from one direction to the opposite No sustained equilibrium is present rather a swift confrontation occurred resulting in a clear victor A Reversal Area that holds on retest ranks among the most reliable continuation signals in the entire methodology by contrast one that breaks accompanied by significant volume expansion often precedes a genuine trend reversal instead of a routine correction
The capacity to distinguish a Balance Area from a Reversal Area instantly under live market conditions separates superficial volume analysis from truly professional Volume Profile application
Volumetric Compression and Expansion the preparatory breathing of the market prior to any directional movement
A third decisive though less frequently emphasized factor is volumetric compression When weekly or intraday volumes contract progressively across successive sessions the market is not expiring but rather accumulating substantial latent potential energy Historically extended compression phases precede substantial directional movements not because compression itself generates the move but because declining participation signals broad market anticipation as operators await a catalyst before deploying significant capital
Why a rigorous protocol proves essential beyond simple intuition alone
Any analyst who has studied a Volume Profile understands how readily absent a disciplined structure one may perceive desired patterns labeling arbitrary volume accumulations as Balance Areas designating random local extrema as Reversals or mistaking authentic compression for routine low liquidity holiday periods Volume information alone remains insufficient a formal methodology is required to establish when a concentration holds real significance how wide a Value Area must extend to qualify as meaningful and how to differentiate authentic directional expansion from isolated noise spikes