What Is the Hindenburg Omen?
In brief, the Hindenburg Omen is a technical indicator designed to forecast a potential market crash within the following 40 trading days. It was first developed by Jim Miekka in 1995, a Florida-based investment newsletter editor with decades of experience in equity market analysis.
The Hindenburg Omen in 2025
The indicator first appeared in 2025 on March 3rd, and its predictive power was promptly reaffirmed by the subsequent market downturn, which bottomed out on April 7th. While some attributed the correction to political factors—namely Trump—the Hindenburg Omen nonetheless signaled the risk.
It re-emerged in the danger zone on August 1st, coinciding with a bearish signal from our proprietary timing algorithm issued days earlier. That correction lasted only two trading sessions, after which the market resumed its strong upward trajectory through the end of October.
On October 29th and 30th, as the first signs of a bearish reversal surfaced, the indicator triggered again—twice in succession—reinforcing the credibility and statistical weight of the signal.
Historical Performance
Had it existed in 1987, the Hindenburg Omen would likely have flagged the infamous crash. It has reliably preceded major downturns, including the initial sharp declines of 2000, 2007, and 2015.
More recently, it signaled the onset of the 2022 bear market on January 5th, following early warnings in November 2021. It also flagged the COVID crash on February 20th, 2020, with similar alerts beginning in late January.
In 2018, it activated on February 1st—just days before the Volmageddon event on February 5th. That September, it triggered on five nearly consecutive days, and again in early October, ahead of the sharp and unexpected autumn sell-off.
Despite these notable predictive successes, the Hindenburg Omen has also produced a high number of false positives. One of the most memorable occurred in 2017, when it triggered ten times during one of the most stable and sideways years in U.S. equity market history.
How the Hindenburg Omen Works
Jim Miekka’s original formulation was designed for the NYSE, though it is now also applied to the S&P 500. The classic criteria are:
1. The index must be trading above its 50-day moving average.
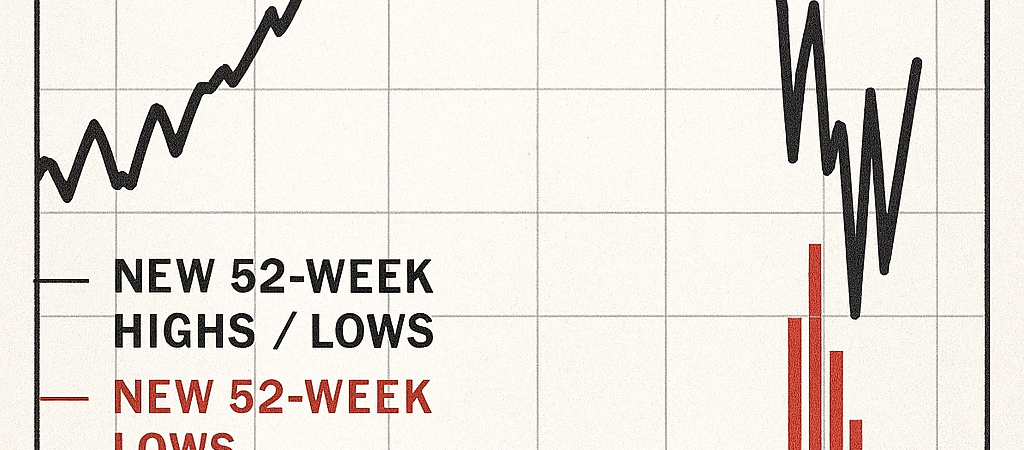
2. The total number of new 52-week highs and lows must exceed 2.8% of all issues traded on the same day.
3. The McClellan Oscillator must be negative.
Bloomberg has since introduced a revised version of the indicator, with updated parameters:
1. The 10-week moving average of the index must be rising.
2. The total number of new 52-week highs and lows must exceed 2.2% of all issues traded on the same day.
3. The McClellan Oscillator must be negative.
4. The number of new 52-week highs must be less than or equal to twice the number of new lows.