Volume Density and Implied Volatility
The density of traded volumes—meaning the number of contracts or shares exchanged within a given time frame—can be seen as the density of a fluid.
• Low Volume (Low Density): Similar to a rarefied fluid, a market with low traded volumes indicates limited participation from market players. This “rarefaction” can result in a fragile market structure, vulnerable to manipulation and characterized by insignificant price movements.
• High Volume (High Density): Like a dense fluid, a market with high traded volumes reflects strong participation and interest from traders. This “density” contributes to a more robust and reliable market structure, with price movements supported by a broad base of participants.
Execution Speed and Volatility
In this context, order execution speed plays a key role. Just as fluid velocity affects its behavior, the speed at which orders are executed can influence market volatility.
Slow execution in a volatile market can lead to slippage and significant losses.
Traders must be able to enter and exit positions quickly to seize profit opportunities and minimize losses.
Modern trading technology has made it possible to execute orders in extremely short timeframes—often in fractions of a second.
This is essential for traders operating in volatile markets, where prices can change rapidly.
Correlation Between Implied and Realized Volatility
Implied volatility, derived from option pricing, represents the market’s expectations of future volatility.
An increase in implied volatility can precede a rise in realized volatility—that is, the actual volatility experienced in the market.
This correlation can be leveraged by traders to manage risk and identify opportunities.
Volume Density and Market Structure
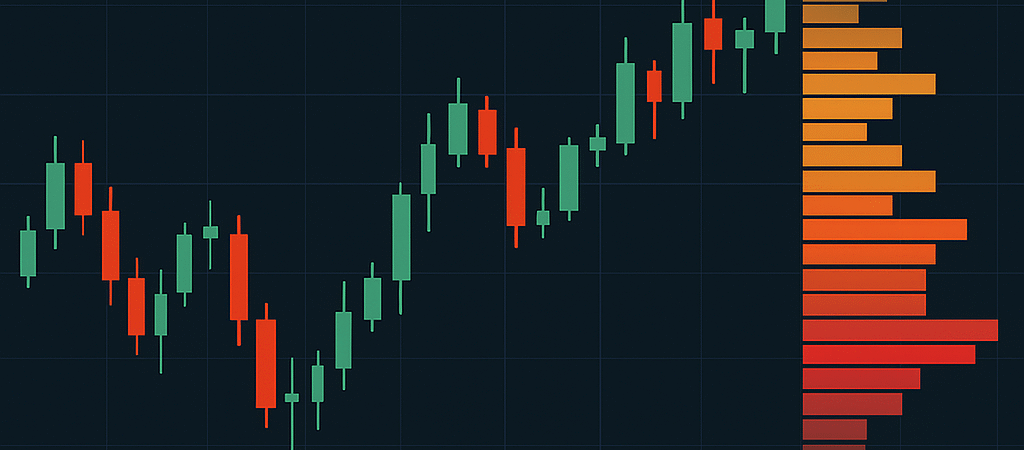
Volume density—the distribution of traded volumes across different price levels—provides crucial insights into market structure.
By analyzing volume density, traders can identify support and resistance levels, as well as areas of accumulation or distribution.
These levels can significantly influence market structure, determining potential points of trend reversal or continuation. In the fast-paced world of trading, where split-second decisions can mean the difference between profit and loss, the relationship between volatility and the density of traded volumes takes on crucial importance.
This dynamic, often overlooked, can be compared to the laws and behaviors of fluids, where volatility represents turbulence and traded volumes represent the fluid’s density.
Conclusion
Understanding the relationship between volume, volatility, and volume density—and their analogy to fluid dynamics—can offer traders a more comprehensive view of market structure.
By monitoring these components, traders can adapt their strategies, identify opportunities, and manage risk more effectively.
Key Points:
• Volatility can be compared to the flow speed of a fluid.
• Traded volume density can be seen as the fluid’s density.
• Order execution speed is critical in volatile markets.
• Execution speed is correlated with implied volatility.
• Market structure is linked to volume density.